Investing can be a complex world, but sometimes the simplest strategies can be the most effective. At Coin Street, we specialize in building simple yet effective strategies to consistently outperform the market. As Leonardo da Vinci once said, “simplicity is the ultimate sophistication,” and we strive to simplify things to achieve our desired outcome.
We’ve developed a quantitative approach that focuses on a few key factors (also called Factor Investing), which have consistently outperformed the benchmark Nifty 50 index. Our approach is driven by three core ideas:
Minimal churn: Many quantitative strategies require frequent rebalancing, which can range from weekly to quarterly. However, this frequent rebalancing can result in higher transaction costs and may also have tax implications. Therefore, we aim to have a strategy with an annual re-balance to minimize transaction costs and reduce short-term capital gain tax.
Beat the market: This is the primary objective considering we are in stock market to make money
Low drawdown: Markets by nature are volatile and go through a period of sharp corrections. In such situations, we need a portfolio of stocks that can stay strong in these volatile periods.
Before we provide details of our strategy, here’s a short brief on factor investing.
Factor Investing Overview
Factor investing is an investment approach that involves selecting stocks based on specific characteristics, or “factors,” that are believed to contribute to their long-term performance. These factors can include things like quality factor, value factor, growth factor or momentum.
The idea behind factor investing is that by focusing on these specific factors, investors can achieve higher returns and lower risk compared to traditional approaches that simply try to pick the best-performing stocks overall. This is because certain factors have been shown to outperform the broader market over long periods of time, and by investing in stocks that exhibit these characteristics, investors can potentially capture some of that outperformance.
There are several types of factors like fundamental factor (calculated from a company’s audited financial statement), momentum factor (calculated from past price performance), macroeconomic factors like interest rates and GDP and so on. These are combined in many ways to devise investment strategy to meet investment objectives.
We work with multiple factors and optimize them to meet our core ideas. In this article, we’re sharing the details of our strategy called “Titans,” which focuses on larger, well-recognized companies.
Define Universe
Let’s start by defining our universe, which is basically a fancy way of saying we’re figuring out which companies we’re going to test our strategy on. Since we’re discussing our large-cap strategy called “Titans,” we’re only considering the top 100 companies by market cap excluding banks, insurance companies, and NBFCs. So, for our back testing, we’ll be identifying the top 100 companies by market cap from the listed universe each year.
Fundamental Score:
Next up is where we calculate the fundamental score for each of the 100 companies in our list. To do this, we’re using 10 financial ratios that we’ve calculated from the audited balance sheet, cash flow statement, and income statement. Think of it as a beefed-up version of the Piotroski f-score.
We’ve made some tweaks to the ratios and instead of the 9 ratios used in the Piotroski f-score, we are using 10 ratios. The calculation is super simple: if there’s a year-on-year improvement in a ratio, we assign 1 point, otherwise, we assign 0 points. We then total up the points for each company, which ranges from 0 to 10.
For the next step, we only consider those companies whose score is 6 or more. We do not want companies which cannot score even 6 on our rating scale.
Return
In step 3 we calculate what we like to call the “return” metric. There are plenty of ways to measure returns, like ROE (Return on Equity), ROCE (Return on Capital Employed), and so on. But we prefer to use the ratio known as “Cash Return on Capital Invested” (CROCI).
CROCI was introduced by Deutsche Bank Group and it’s a cash flow-based metric to evaluate business income. Unlike ROE and ROCE, which are accounting based returns, CROCI considers the cash flow generated by the company. Why do we prefer this metric? Simple! Different companies use different accounting methods and policies, which can make accounting-based ratios a bit wonky. Plus, it’s easier to fudge an accounting-based ratio than a cash flow-based ratio.
Now, let’s get into the nitty-gritty of how we calculate CROCI.
CROIC = After tax operating cash flows/ (Invested Capital)
Invested Capital = Gross fixed assets + Current Assets – Current Liabilities– Cash
Price Strength (Momentum)
In our quest to beat the market, the momentum factor is our final secret weapon. We calculate the weighted average mean return over 3, 6, and 12 months, using different weightage for each period. The exact weightage remains our little secret.
That’s it. We just use these two ratios in our universe to beat the market. How we combine these 2 ratios is our second secret ingredient.
Economic Rationale:
If you’re scratching your head and wondering why we’re using these seemingly random ratios, and how on earth they can help us outperform the market, let’s break it down for you. Our fundamental score filters out companies that have improved their financial performance year over year. The return metric then weeds out companies with lower cash flows returns. Lastly, the momentum factor ensures we only pick companies with higher relative strength. So, essentially, we’re searching for companies that not only show improvement in their fundamentals but also have the potential to outperform the market.
Portfolio Creation
After combining the two ratios, we ranked all stocks in our universe based on a weighted average score. Then, we created an equally-weighted portfolio consisting of 20 stocks, i.e same amount allocated to each stock.
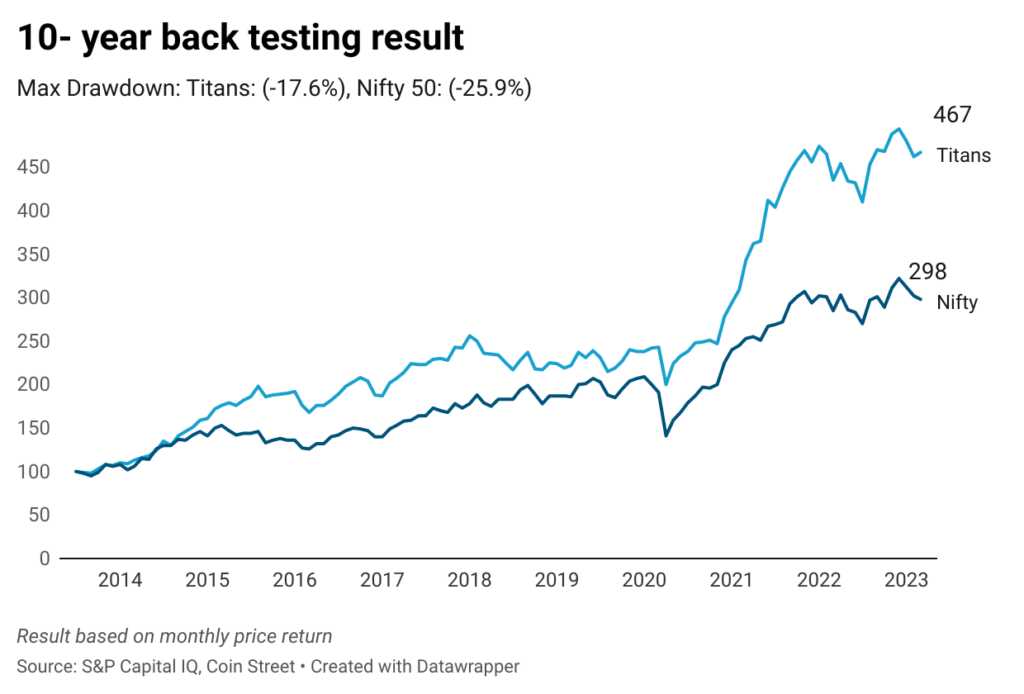
For back testing, we chose the cutoff date as 1st July of each year and did an annual rebalance. The chart below highlights the results of our back testing of the past 10 years, starting from July 2013 up until March 10, 2023. Our start date is 1st July 2013, which uses FY2013 data.

As evident from the chart above, the strategy handsomely outperformed the benchmark. INR 1 lakh invested in Titans would have been ~ INR 4.7 lakhs as compared to Nifty 50 return of ~ INR 2.98 lakhs.
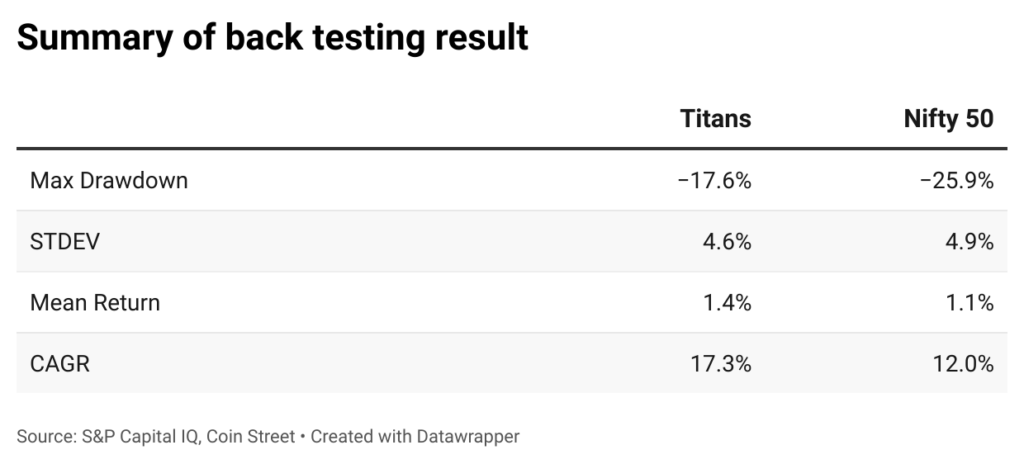
Not only does it deliver significant alpha but the drawdown during covid crash was significantly lower than that of Nifty 50. The table below summarizes the back testing results:

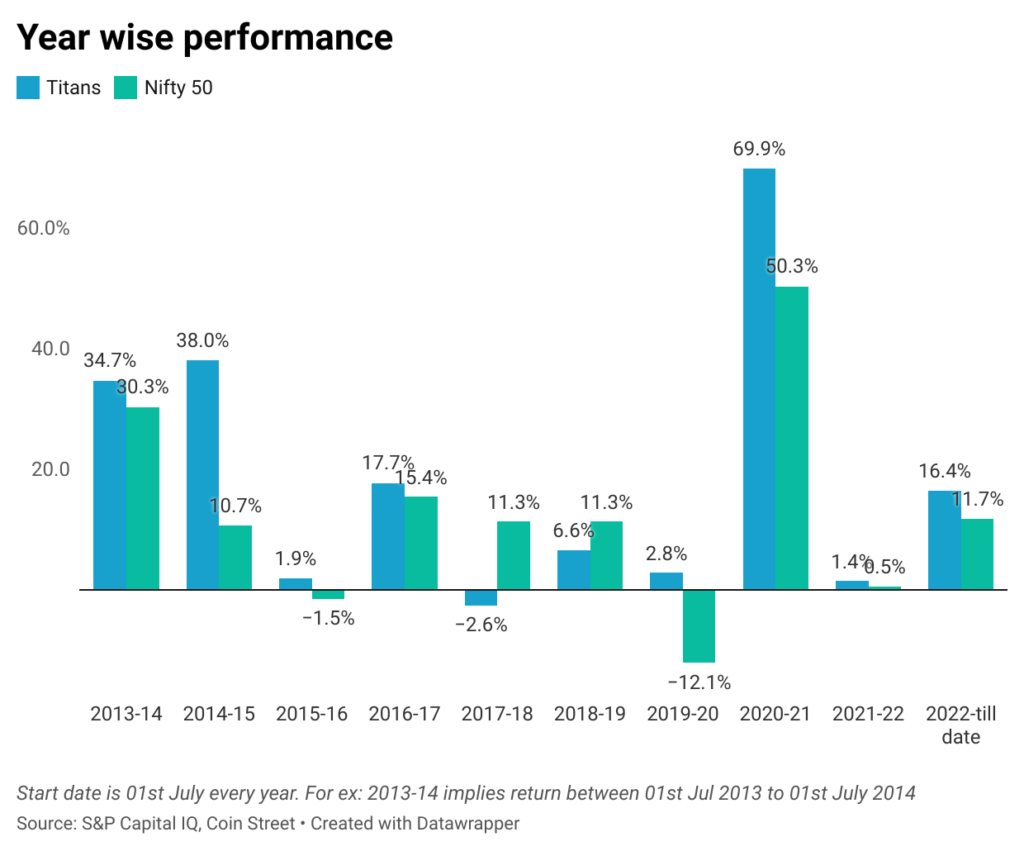
Let’s dive a bit deeper into the back testing result. The chart below in Exhibit 3 shows the year-wise performance. You’ll see that “Titans” outperformed “Nifty” in a staggering 8 out of 10 years. What’s even more exciting is that the returns were negative in only 1 out of 10 years.
This is despite the fact that our universe excluded banks and NBFCs companies which have created a lot of wealth for shareholders in the last 10 years and have significant weightage on the index. And yet, we still managed to come out on top!
The strategy underperformed for 2 consecutive years i.e in 2017-18 and 2018-19. This was primarily due to a very narrow-ranging market where only a select few stocks were doing well. But overall, our strategy meets all our core ideas and philosophy mentioned earlier.

Can we improve on this further ?
While the risk-adjusted returns we’ve discussed so far are healthy, we’re always looking for ways to improve even further. And that’s exactly what we do in our active portfolios.
Now, let’s be honest here. Back testing is great, but it has its limitations. That’s why we take manual checks and prevailing market conditions very seriously.
Here are just a few of the steps we take to ensure our factor investing strategy deliver the best possible returns for our clients:
Accounting Checks: We do essential accounting and governance checks on each of the twenty companies before adding them to our portfolio. We take these checks seriously and if we see any red flags, we immediately remove the company from our list. We believe this is a necessary check that can certainly add to the portfolio return over the long term.
Position Sizing: We also use position sizing to further improve our results. While the back testing we’ve discussed so far is for an equal weighted portfolio, we may change the position sizing depending on the performance of individual stocks in the portfolio and market condition. This ensures that we’re optimizing our returns and minimizing our risk.
Sector Allocation: If we perceive that our allocation to a sector is insufficient, and that sector is performing strongly, we will take appropriate actions to correct the situation
Exit Rules: Finally, we take a lot of pride and confidence in our ability to exit early based on our trend criteria. This helps us reduce the drawdown in individual stocks while keeping our winners riding high. By having clear exit rules in place, we’re able to stay disciplined and avoid any emotional decision making, which can lead to inferior performance.
In conclusion, by combining our research process, active management, and disciplined approach, we’re confident that we can continue to deliver strong returns for our clients over the long term.
If you have any comments or suggestions, please feel free to write below or reach out to us.


