Introduction
Visual observation is a very powerful skill which can help you in a big way in your wealth creation journey. When I started looking at technical charts, I was overwhelmed with the number of technical indicators, chart patterns, trading strategies which are there, and I found out hard to figure out a well-defined system which can help in my investing journey. After reading many books and observing markets for a few years, I have identified 6 simple rules which work extremely well in identifying winning stock.
These are so simple that even a beginner can start applying them. All it requires is a little observation and discipline in your trade management. I have also provided examples and case studies to help you make the most out of it.
Rule 1: Focus on stock making new 52-week highs or all-time highs.
We are not interested in buying lows or catching bottoms. As a beginner, I was very keen to buy stocks at low and aiming to sell high. But the real profit started showing, when I explored this idea of identifying stocks hitting new highs. This requires some mental shift but once you observe and practice, you will realize this for yourself, how profitable this set up is. One line explanation to why this counter-intuitive strategy works is as follows:
Stocks move based on demand and supply. When a stock hits a new high, it is an indication of more demand and less supply. As it keeps moving higher, overhead supply decreases and more and more buyers are now interested. So, all dips get bought.
Lot of websites offer information about stocks hitting a new 52-week high or an all-time high. However, I’ve personally found the trading view link to be particularly useful. It allows you to directly open the chart from the list for a quick check.
Rule 2: Refining the list
Not all that glitters is gold. The same is the case with the stock market. Not all stocks which hit a new 52-week high will turn out to be multi-bagger. We need a solid refinement process. Follow these steps to refine the list further:
- Long Consolidation: Stocks must be in a long-term consolidation (i.e sideways move) either after a long downtrend (preferable) or uptrend. This is the part where you need some visual observation skills. A long-term consolidation typically means stocks moving in a range and price structure would look like a horizontal line. In technical terms, it is also called a base formation process. Stocks which do not have proper base formation have a lower probability of success. Smoother the base formation process, higher is your probability of success. We will explain this further through an example shortly in this article.
- Track Smart Money Activity: This is not a mandatory criterion but an extremely useful one. Insiders (Promoters, CEOs, CFOs etc) and Institutional investors (FIIs, DIIs, etc) money is referred as Smart Money. They have a better visibility about a business and start building up position over 3-6 months (i.e during the consolidation period). Since they have to deploy huge capital, they need to do it over a certain period. So, before entering a trade, check out the shareholding pattern of FIIs, DIIs and Promoters over the last 2-3 quarters.
- Sector Trend: Prefer stocks from the sector which are showing strength and outperforming. This can dramatically increase the odds. Also, at times an entire sector breaks out and starts rallying. This creates most profitable opportunities and do not hesitate in entering even if stocks have rallied 10-20% after breakout.
Rule 3: Volume on breakout
Prefer stocks with above average volume when they hit a new 52-week high or all-time high. By above average volume, we mean volume at the time of breakout should be more than 20- or 50-day average volume. Volume is like fuel to the Rocket. Strong volume breakout indicates extremely high interest from the market participants. We will explain this shortly via examples
Rule 4: Moving Average Check
Moving averages are one of the simplest technical indicators but they are still powerful in visualizing trends. This is the only technical indicator that we will apply here as we are not much in favour of using lot of indicators. It complicates more and doesn’t add any incremental value. Let’s come back to our rules now.
We will only consider those stocks which are above its 50- and 200-day moving average. Also, it is desirable to have 50 day moving average line to be above 200 day moving average. All charting software and websites provide this indicator.
Rule 5: Free Float
This is not a mandatory condition but again a very useful one in increasing your return percentage. For those of you who don’t know, Free float refers to the portion of a company’s shares that are available for trading by the public and are not held by controlling interests, such as insiders, promoters, or large institutional investors. So, to calculate the % of free float, deduct the shareholding of promoters or other strategic investors from 100%. If Promoters hold 75% in a company and there are no large institutional or strategic investors, then free float is 25% (100%-75%)
For our set up, we would like to have a free float anywhere between 10-20%. It is important to highlight that free float is like a double edge sword. A stock with smaller free float like 1-5% is susceptible to huge manipulation and even a small amount of buying can push the stock by 10-15%. Also, exiting from such stocks can become difficult as when the tide turns, these stocks may continue to hit lower circuits. So, it’s important to be careful with this criterion. 10-15% or 10-20% free float is good enough.
Why have we put free float criteria?
Remember at the beginning of this post, we have mentioned that stocks price movement is a function of demand and supply. A stock with low free float will have very little supply. So, if demand increases, there will be a large imbalance in demand and supply, and this would push the stock price in a different orbit and this is what we want. Again, a word of caution that it’s a double-edged sword so trade carefully with this criterion.
Rule 6: General Market Check
We do not want a market which is in the corrective phase or a bear market. General market trend acts like a wind which can power all the sailboat sailing in the sea. So, when market trend is positive, it benefits all the stocks, and the odds are in your favour to put more money. For this, we will again use the moving average indicator. Our ideal condition is to have Nifty 50 (headline) and Nifty 500 (indication of broader market) to be above its 50-day moving average or 200 day moving average and 50 day moving average to be above 200 day moving average.
Now, let’s take some case studies to explain the above principles. One final word before we proceed with case studies, we are only interested in small and mid-cap stocks with the above set up as we are aiming for higher returns anywhere between 50-100% or more in a short time frame (12-15 months). A TCS or HDFC Bank or other blue chip will not offer this kind of return in a shorter time frame.
Case Study 1: RVNL
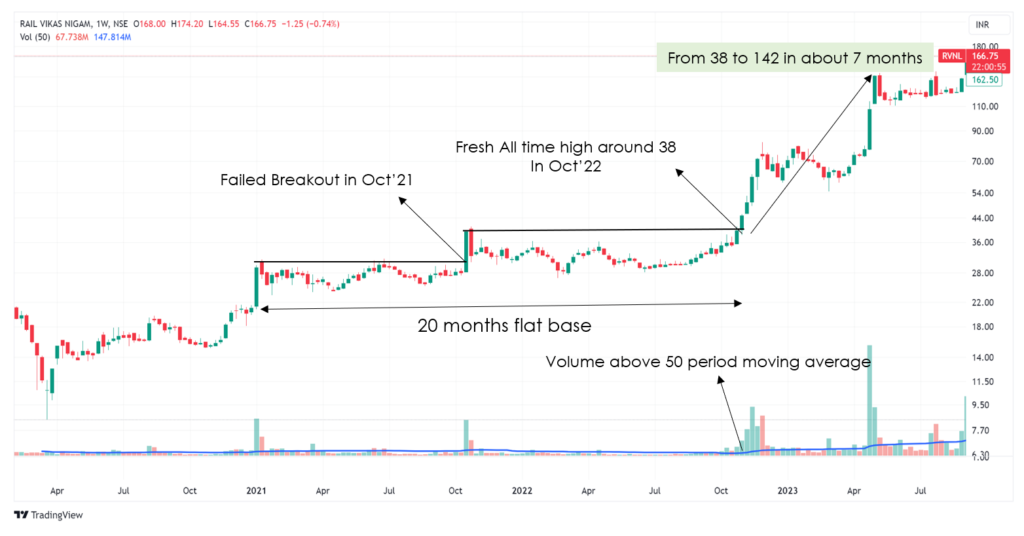
Analysis: RVNL attempted its first all-time high breakout in Oct’21 but it turned out to be a failed breakout. This attempted breakout was from an 8-month base which is not very long but acceptable. The volume at the time of breakout was more than 50 day average volume. Hence, even this criterion was met. Let’s look at the shareholding pattern
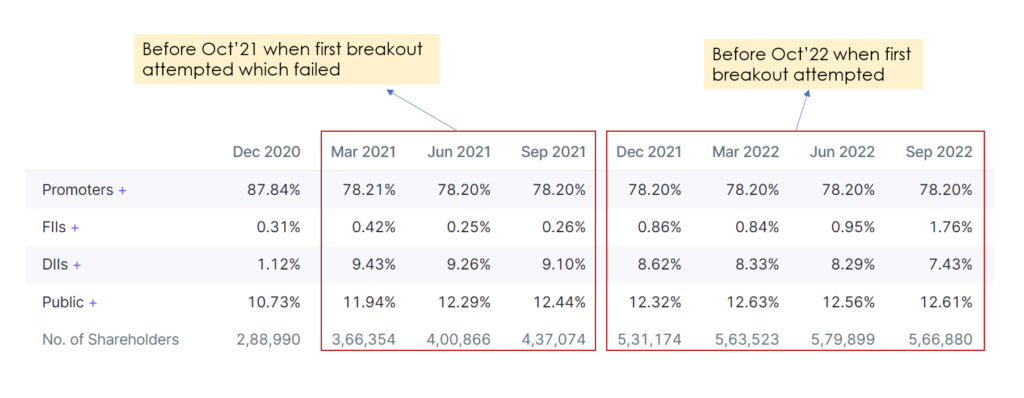
There was not much accumulative witnessed in last 2-3 quarters from either FIIs or DIIs before Oct’21. The increase in their shareholding between Dec’20 to Mar’21 was due to government OFS (offer for sale) to reduce their holding. Post that both FIIs and DIIs have been selling and retail investors were buying, which is not what we want.
Free Float: Free float was ideal as 78% were owned by government and another 9-10% owned by institutions. Hence, free float was only ~12% which was ideal for us.
Moving Average Check: Stock was above both 50- and 200-day moving average with 50 day moving average being above 200 days. So, this criterion was also met.
General Market Check: While the market was in a strong bull run, it made its top in Oct’21. While identifying top and bottom is impossible, what we should avoid is buying during a late-stage bull market. By Oct’21, the market had experienced a strong rally of ~18 months. All headline indices were trading significantly above their long-term valuation averages. Monthly RSI was also near 80 signalling market top. Macro factors like bond yields had started rising. In such scenarios, these breakouts are susceptible to failure.
Hence, In the first attempt, RVNL did not met 2 criteria of favourable general market conditions, institutional accumulation.
Now, let’s evaluate the same breakout in Oct’22. By this time, RVNL had approximately 20 months of consolidation. The volume was above 50-day average volume. FIIs have been accumulating the stock. Market made in its bottom in Jun’22 so it was not a late-stage bull market and markets. Nifty was trading above both its 50-day moving average and two hundred day moving average. This breakout was successful and delivered impressive returns of more than 3x in 7 months.
Stop Loss Placement: Stop loss to be placed below the low of the breakout candle. Since we are using long term chart i.e weekly or monthly, this may be a little far from the breakout price (but not more than 10-15%). We should be all right in accepting this much loss.
Case Study 2: GMM Pfaudler

Analysis: We have already marked key points on the charts. GMM Pfaudler has had a stellar run. It was a micro-cap in 2014 when it first broke out of 4 year long consolidation. Stock rallied almost 3 times in 8 months. Stock entered another consolidation of 2 years after which it rallied an impressive 17.5 times. The promoters owned ~75% and there was very little institutional holding given its small size. Available Free float was ~25% which is in line with our rules. Institutional holding started increasing from 2018 onwards post which stock witnessed almost vertical up move. Note that there was bear market in small and midcaps during Jan-2018- Mar’20.
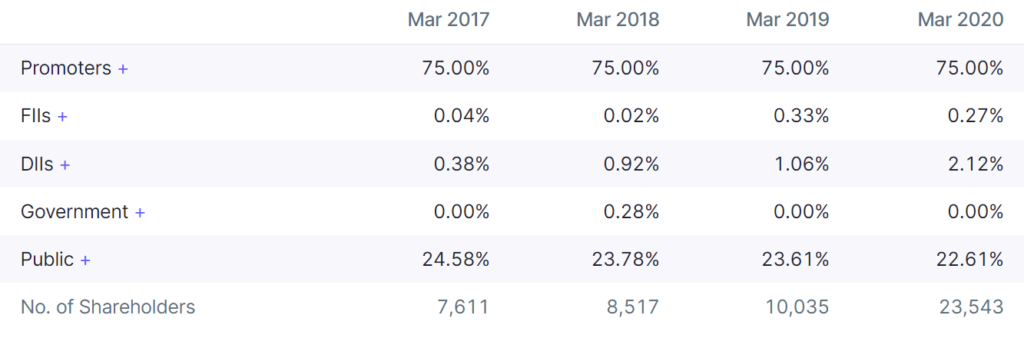
General market: Stock broke out in Jul’16 when market was strong. There was minor correction due to demonetization, but the bull market continued till Jan’18. After Jan’18, mid and small caps started correcting. While the stock remained strong, the right approach would have been to keep a trailing stop loss.
Such patterns keep repeating and the best way to find them is to track the new highs and then analyze the set up based on the above rules and the rest is only risk management. For further analysis, we have presented some more charts with similar set ups, and you can analyze them with the above guidelines.
Note that nothing in the market has a 100% success rate. We need some framework and guidelines which can improve our odds and rest is proper risk management.
Case Study 3: Alkyl Amine

Case Study 4: Mirza International

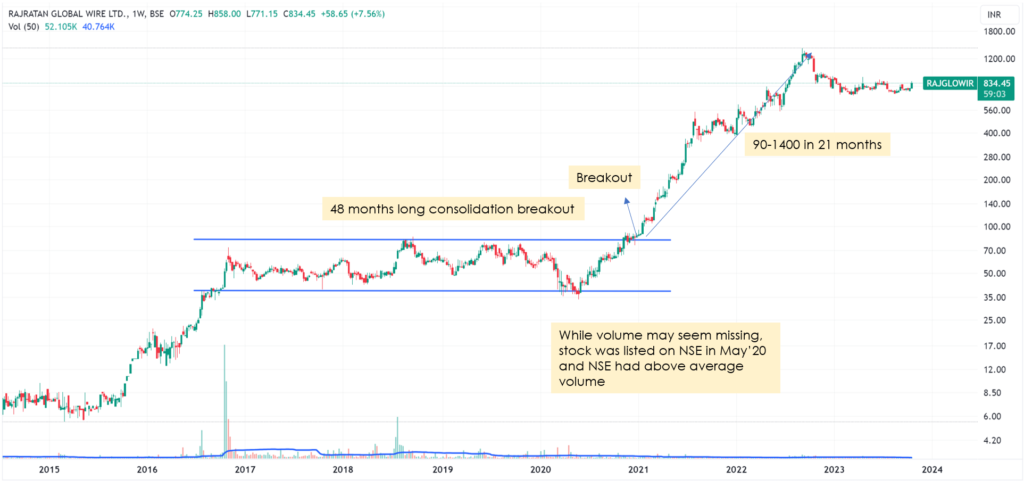
Case Study 5: Rajratan Global Wire
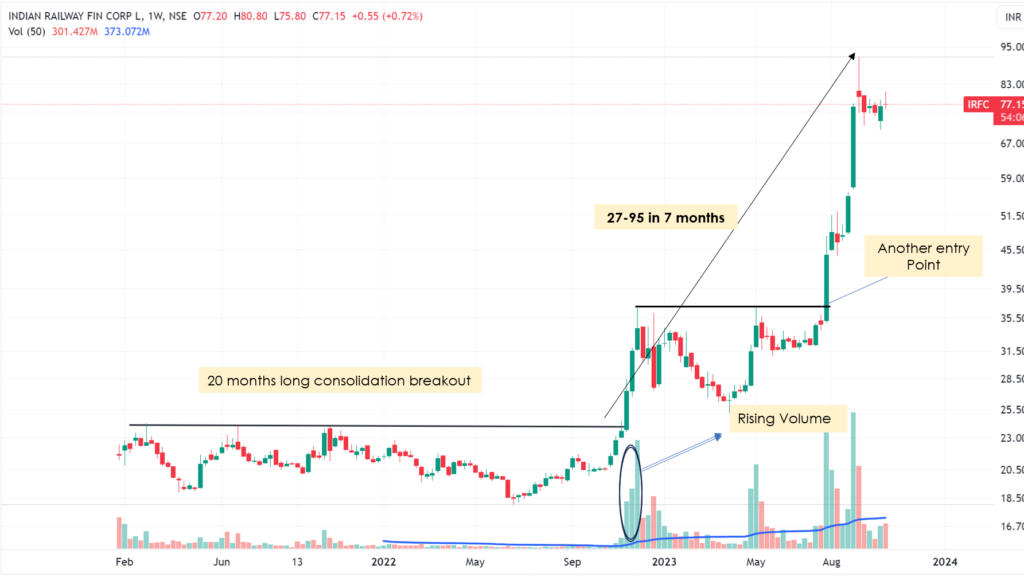
Case Study 6: IRFC
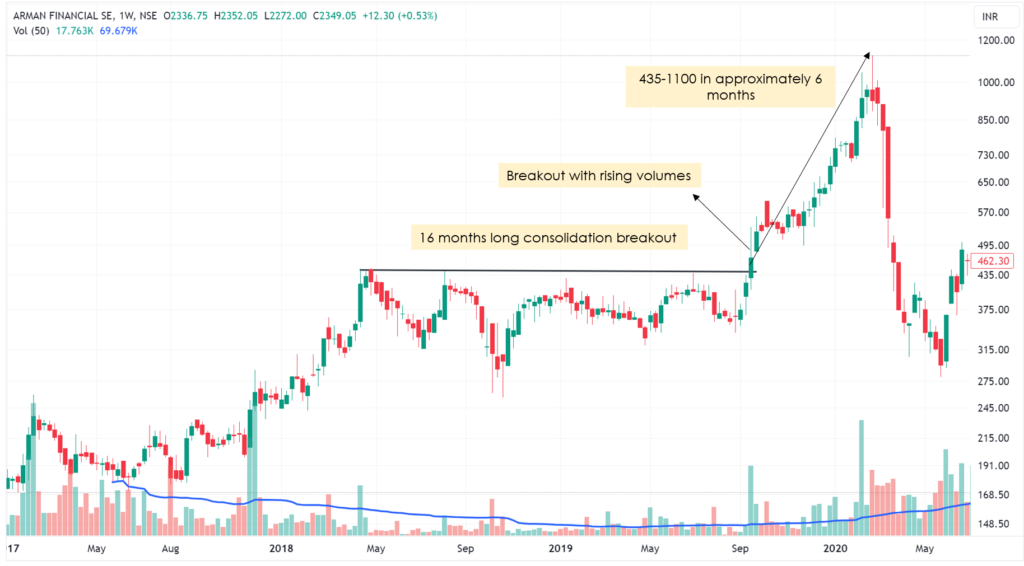
Case Study 7: Arman Financial
Conclusion:
The stock market is like a wide ocean, and it requires a good navigation tool. The key is to have the right mental models and strategies. It might be fundamental, technical, or a mix of both. In this article, I have shared a simple and effective technical chart-based approach. I have personally found it to be particularly useful and hope you too find it useful in your investing journey


