Introduction
In a recent report published in Economic Times, approximately 60% of equity mutual funds failed to outperform the benchmark. As per the report, performance of small and midcap mutual funds was even worse. Approximately ~88% of small cap funds and ~86% midcap funds failed to outperform the benchmark in FY24. While one year is not a correct time frame to evaluate fund performance, even over a 5-10 year time horizon, the numbers are not very encouraging. As per report by SPIVA (S&P Indices vs Active Funds), mid and small cap funds also fared the worst in the long run, with 75 percent of them lagging the S&P BSE 400 MidSmallCap Index over the 10-year period ending December 2023. This is important to highlight because most new investors have been doing their SIPs or investing their savings in small and midcap funds.
Given that the majority of actively managed funds failed to beat the benchmark, the case for passive investing via index funds or ETFs such as Nifty Bees gets stronger. Mutual fund managers understand this and therefore we have witnessed a significant surge in launch of index funds. In this article, we highlight one such index funds whose performance stands out. Its not only better than other index but also outperforms all major actively managed small and midcap funds.
The index which we are talking about is Nifty Alpha 50 Index. Kotak Mutual Fund and Bandhan Mutual Fund have launched an ETF and an Index fund, respectively, which track this index (ETF Symbol: ALPHA).
What is Nifty Alpha 50 Index ?
The Nifty Alpha 50 index tracks the performance of 50 stocks listed on the National Stock Exchange (NSE) with high alpha values, which indicate their out-performance relative to the market. The index is reviewed quarterly, and stocks are selected based on criteria such as domicile in India, trading on the NSE, ranking in the top 300 by free-float market capitalization and turnover, a minimum one-year trading history, and a 100% trading frequency in the last year. Stocks are ranked by alpha, calculated using one-year trailing prices adjusted for corporate actions, and the top 50 are included in the index. Weights of securities in the index are assigned based on the alpha values i.e. security with highest alpha in the index gets highest weight.
Nifty Alpha 50 Past Performance
Now it’s time to look at the past performance of this index. This index was launched in November 2012 and hence has a good past history of approximately 12 years. To evaluate the performance, we looked at 5 data points.
- Past performance over multiple time frames (i.e., 1 year, 3 years, 5 years, etc.) versus frontline indices such as Nifty 50, Nifty Midcap, and Nifty Smallcap.
- Rolling return over different time frame i.e 1-year, 3 year , 5 year, 7-year and 10-year
- Monthly SIP Returns
- Performance during bear market
- Performance comparison with respect to some of the top performing actively managed funds in last 10 years
Lets look into these data points one by one.
The table below highlights the performance summary of Nifty Alpha 50 index along with front line index and some of the other strategy indices.

Nifty Alpha 50 has outperformed all other indices across almost all time frame. In only one instance i.e over the last 3 year period, it couldn’t beat the Nifty Midcap 100’s performance. This is quite remarkable. We have also included the Nifty 200 Momentum 30 index in the above list because this strategy is very similar to the Nifty Alpha 50, and the performance of both these indices is closely related
Next, we look at its rolling return. Before we get into the data, let’s quickly understand what rolling return means.
Rolling return is one of the most useful criteria for evaluating mutual funds. It is considered the best measure of consistency and likelihood of returns. For example, if you see 15% rolling returns for 3yrs, it means that if you pick any 3-year period across the fund’s life, the fund is likely to give 15%. Hence, funds with good and consistent rolling returns across most time frames have a higher likelihood of delivering similar performance to their investors. It significantly removes timing biases. To give an example, here is a summary of the rolling returns of the Parag Parikh Flexicap Fund across time frames.

This is quite a consistent return across time frames, and therefore, most investors in Parag Parikh would have experienced similar returns. Now, with this background, let’s look at the rolling return of Nifty Alpha 50.
Rolling Return performance Summary

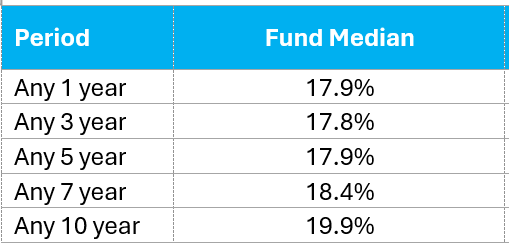
The rolling return of this index is quite consistent, comparable to the Nifty 50. Further, the returns across time frames are quite impressive and are above 20%
SIP Return
Considering most retail investor, invests via SIP route, we also looked at XIRR of the monthly SIP return over last 10 years.

In line with above, SIP returns are also better than other indices. However, the Nifty Midcap stands out in SIP return performance compared to its median rolling return.
Draw-down Analysis
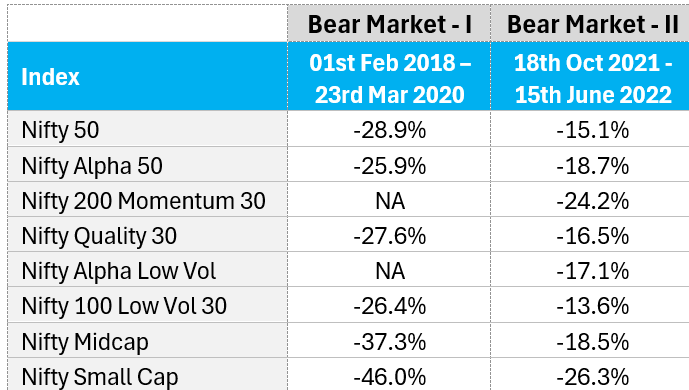
Next, we look at its performance during bear markets. We examined two bear market periods: from 1st February 2018 to the COVID lows of 23rd March 2020, and then from October 2021 to June 2022.

The Nifty Alpha 50 index corrected by approximately 26% during the 2018-2020 bear market and COVID crash, and by approximately 19% during the October 2021 to June 2022 bear market. In comparison, the Nifty 50 index fell by approximately 29% and 15% in these periods, respectively. The Nifty Midcap and Smallcap indices fell even more. Hence, the risk metrics for the Nifty Alpha 50 index are fairly balanced.
Comparison with Actively Managed Fund
The above data makes a stronger case for investing in Nifty Alpha 50 index. However, there are many actively managed funds. Does it make sense to choose this index fund over actively managed funds? To answer this, we looked at the 5-year and 10-year performance data of some of the top performers among small-cap funds in the last 10 years. We have considered only small-cap funds, as this category of funds had the best performance in the last 10 years. The table below provides a quick performance summary of the Nifty Alpha 50 in comparison to some of the top actively managed funds.

Except for the Nippon Small Cap Fund, all other funds have failed to beat this index over the last 10 years. Moreover, as a fund’s size grows bigger, it becomes increasingly difficult for the fund to maintain its past performance. Furthermore, there are risks associated with changes in the fund manager, among other factors.
Conclusion
As the mutual fund industry grows, it will become increasingly difficult for fund managers to outperform. Hence, it’s important for investors to allocate a portion of their portfolio to index funds. While most investors are investing in the Nifty 50 index as a passive strategy, there are other indices that offer better risk-adjusted returns. In this article, we presented data for one such index. We create many such factor-based investing strategies that consistently outperform. Factor-based strategies eliminate human bias and are entirely data-driven, and hence have the potential to offer much better risk-adjusted returns.


