Introduction
If you’re new to the world of trading and technical analysis, the Relative Strength Index (RSI) is a powerful tool you need to know! In this tutorial, we’ll cover the basics of RSI and how you can use it to make informed trading decisions. We will also highlight how to use this to identify potential trend reversal.
What is Relative Strength Index (or RSI)?
Relative Strength Index or RSI is a momentum oscillator that measures the speed and change of price movements. It oscillates between 0 and 100 and helps traders identify overbought and oversold conditions in a market. RSI is calculated based on the average gain and loss of an asset’s price over a specified period, usually 14 days. The RSI is calculated using the following formula:
RSI = 100 – (100 / (1 + RS))
Where:
- RS (Relative Strength) is the average of the “upward price changes or gains” divided by the average of the “downward price changes or losses” over a specified period.
To calculate the RS, you need to follow these steps:
- Calculate the price change for each period (usually daily price changes) by subtracting the previous day’s closing price from the current day’s closing price
- Separate the positive (upward) price changes from the negative (downward) price changes
- Calculate the average of the upward price changes (Avg up) and the average of the downward price changes (Avg Down) over the specified period
- Finally use the RS formula to find the Relative Strength (RS)
Once you have the RS value, you can use it in the main RSI formula to calculate the RSI value.
Don’t worry if you do not understand it as you don’t need to calculate it. Most charting software offers this indicator. What is important is its applications and how to use it for a profitable trading and investing opportunities
It’s important to note that the period used for RSI calculation is a user-defined parameter, and the most common period used is 14 days, but it can be adjusted based on the trader’s preference and the specific asset being analyzed.
Relative Strength Index (RSI) – Thumb Rules:
RSI Range: The RSI scale ranges from 0 to 100. Generally, an RSI reading above 70 indicates an overbought condition, while an RSI below 30 indicates an oversold condition.
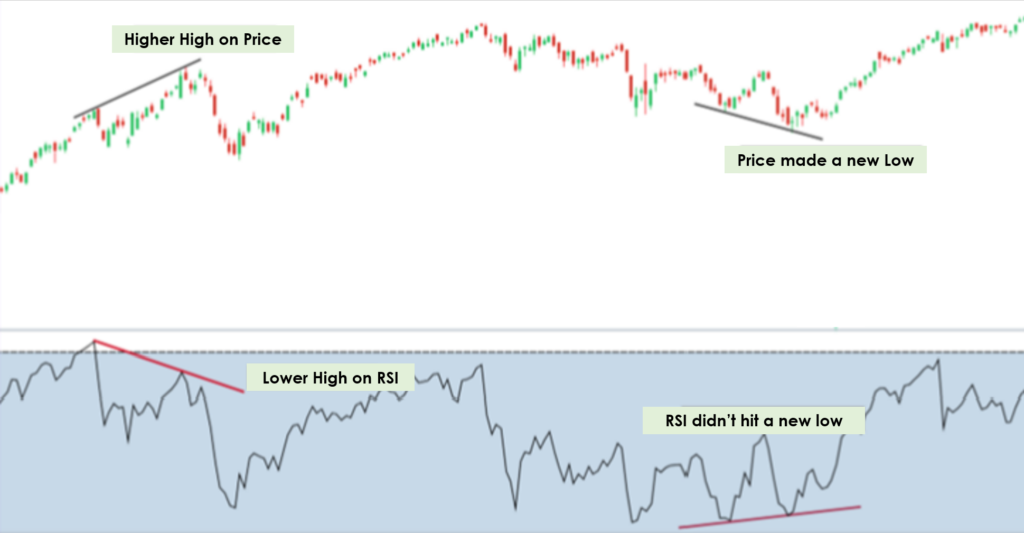
Divergence: RSI divergence occurs when the price trend and RSI trend move in opposite directions. Bullish divergence occurs when the price makes lower lows while RSI makes higher lows, indicating a potential upward reversal. Bearish divergence occurs when the price makes higher highs while RSI makes lower highs, suggesting a potential downward reversal
How to Trade or Invest using RSI ?
It is important to highlight that RSI is just an indicator and not a full proof strategy. Hence, it’s not advised to trade solely based on one indicator. RSI may be combined with other indicators and price actions for high probability set up. However, here are few useful applications of RSI
Identifying Overbought and Oversold Conditions: RSI helps traders spot potential reversal points. When RSI is above 70, the asset may be overbought, and a pullback or trend reversal could be imminent. Conversely, when RSI is below 30, the asset may be oversold, indicating a potential buying opportunity.
Confirming Trends: RSI can confirm the strength of a trend. In a strong uptrend, RSI tends to stay above 50, while in a downtrend, it stays below 50. This can help traders confirm the validity of the prevailing trend.
Divergence Trading: RSI divergence can be a powerful tool to predict potential trend reversals. Keep an eye out for bullish and bearish divergences to time your entries and exits more effectively. Here is a snapshot of Bank nifty chart to highlight what divergences look like.
RSI: Applications and Examples
Identifying Market Tops and Bottom (Medium and Long Term)
Navigating the markets can be a challenging task, especially during euphoric bull runs when exuberance tempts us to make impulsive decisions. The Relative Strength Index (RSI) emerges as a valuable guide, helping investors like us stay grounded and avoid potential pitfalls.
By analyzing monthly charts with RSI, we gain valuable insights into the general market direction. When the RSI surpasses 80 on a monthly time frame, it serves as a warning sign that the risk-reward balance may no longer favor fresh investments. Waiting for a pullback and market correction becomes a prudent approach to protect our capital.
Looking back at historical examples, the RSI has proven its worth. In 2007, 2015, and 2021, RSI pointed to overbought conditions before significant market corrections. This reinforces its role in safeguarding against losses and preserving capital during volatile periods.
Note that longer term time frame has lesser noise, so it offers better insights into market trend
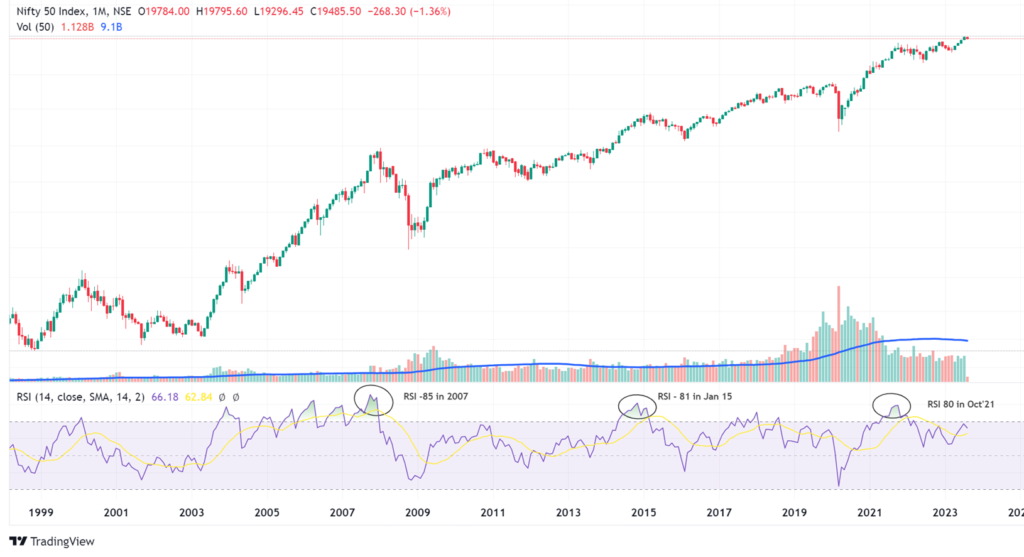
Pro Tip: If RSI is an overbought conditions (i.e above 80) and market is nearing some resistance level then one can take short trade (through futures and options) on index as risk reward is highly favorable. One can use Fibonacci/camarilla pivots to identify overhead resistance. Similarly, when RSI is around 30 and is near a support levels, strong buying opportunity emerges
Trading Divergences
Divergence trading is one the most popular and effective use cases of RSI indicator. Divergence alerts traders regarding the sustainability of the trend. We have already shared how divergence looks like in Exhibit 1 earlier. In this chart, price made a new high, but RSI didn’t. This is called bearish divergence and price eventually corrected.
Similarly, when price makes a new low, but RSI doesn’t follow, this is called Bullish Divergence. Refer Exhibit 1 and see how price reversed.
How to Book Profits in Raging Bull Market?
During a strong bull market, investors often face a tough question: when should they lock in profits on their stocks? The Relative Strength Index (RSI) comes to the rescue in making this decision. Let’s look at some easy-to-understand examples to illustrate how RSI can guide us.”
1. Indiamart Intermesh:
Indiamart Intermesh witnessed a sharp rise in its share price during the market rally that commenced post covid crash. However, stock made an early top in Feb’21 (Bull market lasted till Oct’21). Look at RSI. In Feb’21, RSI was 91. Stock also made double top confirming the end of its bull run.
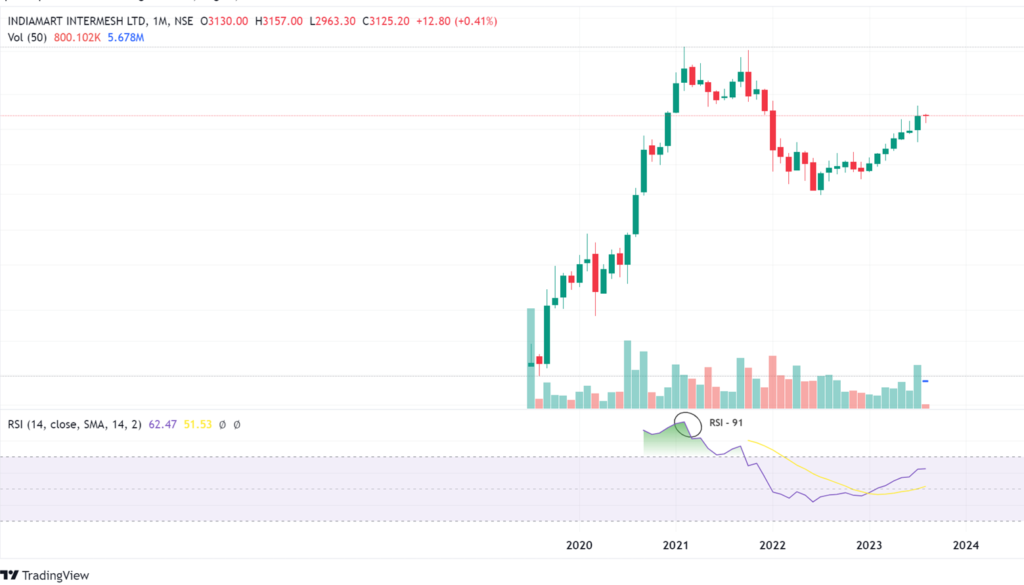
Pro Tip: For Index, RSI of above 80 or 85 indicates overbought zone and medium term topping out signal. However, for individual stocks we have observed the peak happens above RSI reading of 90. Although stock (or index) may continue to trade sideways, and RSI may head lower. Risk reward becomes unfavourable. Investor may use additional signal like moving averages, double top, trend line break, overvalue zone etc for exiting stocks.
2. Indian Energy Exchange (IEX)
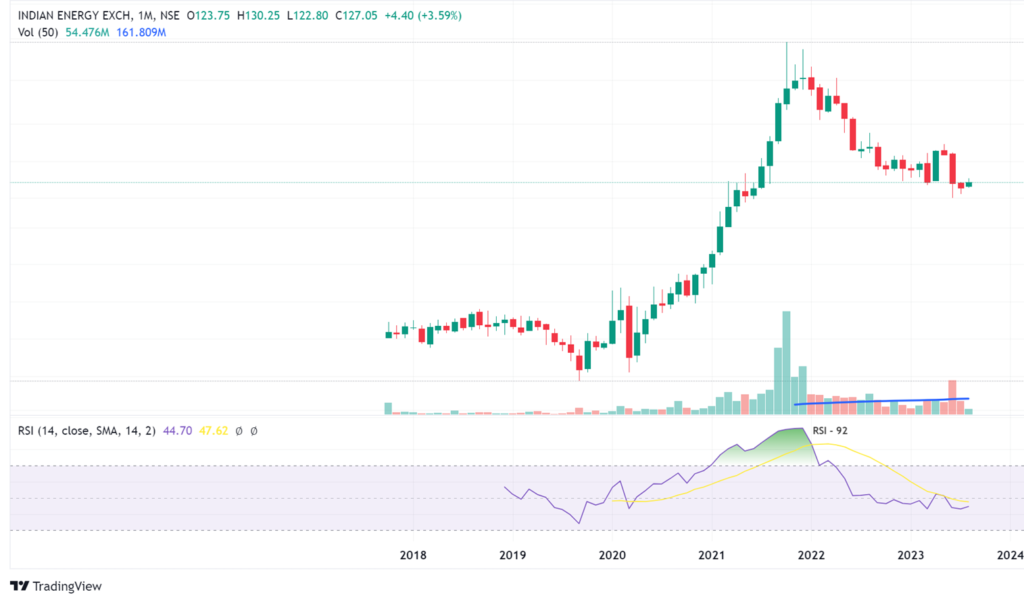
IEX had an RSI of 92 when it peaked. Also note the candle stick pattern. Over the next 3 months, Price faced rejection from higher levels. It’s always good to have additional conformation and not solely rely on one indicator as no indicator works 100%.
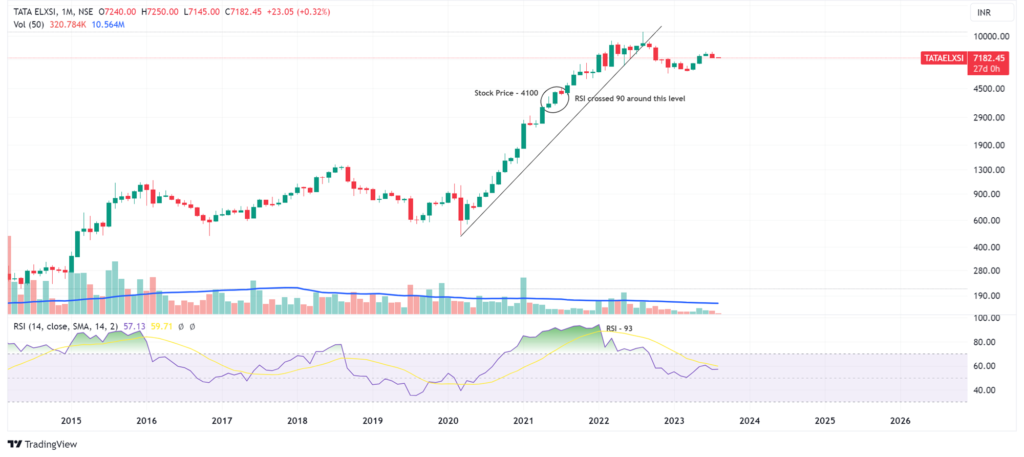
3. Tata Elxsi
This is an interesting example. Monthly RSI crossed 90 in Jun’21. Stock continued to rally and touched ~10000 levels. Exit condition was triggered when the stock broke trend line in Sep’22 and RSI continue to remain in overbought region.
We hope these examples have provided you with a clear understanding of how to apply the RSI indicator effectively. Since our primary focus is on long-term investing, we consistently favor the use of higher time frames, such as monthly or weekly charts, to gain better insights. If you have any questions or need further clarification, please don’t hesitate to ask; feel free to leave your queries in the comments section below. We’re here to assist you in any way we can. Happy investing!


1 Comment
kcdineshkarwa
Take a example with data any script to clear rsi & rs